Thermal Imaging Survey PPM Services UK – Electrical Fault Detection
Duty holders, landlords and facilities managers use electrical thermal imaging surveys to see hidden overheating on live distribution so they can control fire and downtime risk. Infrared inspections under real load reveal loose joints, overloads and imbalance where permitted, feeding into a structured PPM plan alongside EICR and PAT. You finish with a clear, prioritised report that shows what was inspected, what needs action and how often to resurvey, with findings documented in language boards, residents, insurers and lenders understand. It’s a practical way to move from “no issues reported” to defensible, evidence‑based maintenance decisions.


Author
Izzy Schulman
Using thermal imaging surveys to control electrical risk
As a duty holder or facilities manager, you cannot rely on “no trips” or “no smells” as proof that electrical risk is under control. Most failures start as small hot spots at joints and devices that standard time‑based checks will not see under real operating load.

A structured thermal imaging programme adds live condition evidence to your PPM so you can target tightening, re‑termination and testing where deterioration is actually starting. Used alongside EICR and PAT, it helps you prioritise boards and feeders, reduce unplanned outages and present clear, defensible maintenance decisions to stakeholders.
- See overheating on live switchgear before failures escalate
- Focus EICR, PAT and remedials where risk is highest
- Build repeatable, evidence‑based PPM across single or multi‑site estates
Need Help Fast?
Locked out, leak at home, or electrical issue? All Services 4 U provides 24/7 UK locksmith, plumbing, electrical.
Testimonial & Clients Who Trust Us
With 5 Star Google Reviews, Trusted Trader, Trust Pilot endorsements, and 25+ years of experience, we set industry standards for excellence. From Dominoes to Mears Group, our expertise is trusted by diverse sectors, earning us long-term partnerships and glowing testimonials.
Worcester Boilers
![]()
Glow Worm Boilers
![]()
Valliant Boilers
![]()
Baxi Boilers

Ideal Boilers

What an electrical thermal imaging survey is – and why “no issues reported” isn’t the same as “risk controlled”
An electrical thermal imaging survey is a live, non‑intrusive inspection that makes hidden overheating visible before it becomes a fault.
Most electrical failures start as small changes at terminations, busbars and devices that quietly run hotter than they should. A thermographic survey uses an infrared camera on energised, loaded equipment to capture temperature patterns on switchgear and distribution so you see abnormal heat before you see trips, smells or smoke.
For you as a duty holder, landlord, facilities or asset manager, this adds live condition evidence to planned maintenance instead of relying only on time‑based checks. It does not replace statutory inspection or testing; it adds real‑world operating insight so you can focus those resources where deterioration is actually starting to show.
“Nothing reported” often just means “nothing has failed loudly yet”. If you cannot point to recent, load‑based observations of critical boards and feeders by thermal imaging electricians, you are still carrying unquantified fire and downtime risk. A structured thermal imaging programme moves you from assumptions to observable facts, so you can defend maintenance decisions to boards, residents, insurers and lenders.
All Services 4U designs thermal imaging survey PPM services around that principle: clear, live condition evidence on the assets that matter most, with minimal disruption.
Which electrical faults thermography can realistically flag in buildings – and which it cannot
Thermal imaging is strongest when you use it to find abnormal heat patterns that match known electrical failure modes.
What it does well
A competent survey can help you flag:
- Loose or high‑resistance joints: – small, intense hot spots at lugs, bolted connections, busbar joints, fuse carriers and contactors.
- Overloaded circuits: – conductors, breakers or bars running noticeably hotter than comparable phases under similar load.
- Phase imbalance and neutral stress: – one phase path consistently hotter than others, or neutrals running unexpectedly warm in three‑phase systems.
- Component deterioration: – unusual heating around breakers, contactors, UPS paths, MCC feeders or isolators that suggests increased internal losses.
You are not “seeing electricity”; you are seeing where electrical energy is being lost as heat in a way that does not fit the expected pattern. Those patterns then drive targeted follow‑up: tightening, re‑termination, replacement, load balancing or power‑quality investigation.
What it cannot prove
Thermography cannot:
- Confirm earth fault loop impedance, disconnection times or fault current capacity.
- Prove insulation integrity or polarity.
- Replace a periodic inspection and testing report under wiring regulations.
- Guarantee that “no hot spots today” means “no risk” in future operating states.
You still need inspection and testing to verify safety and compliance. Thermal imaging sits alongside that regime as a condition‑monitoring tool, showing you where to focus and in what order.
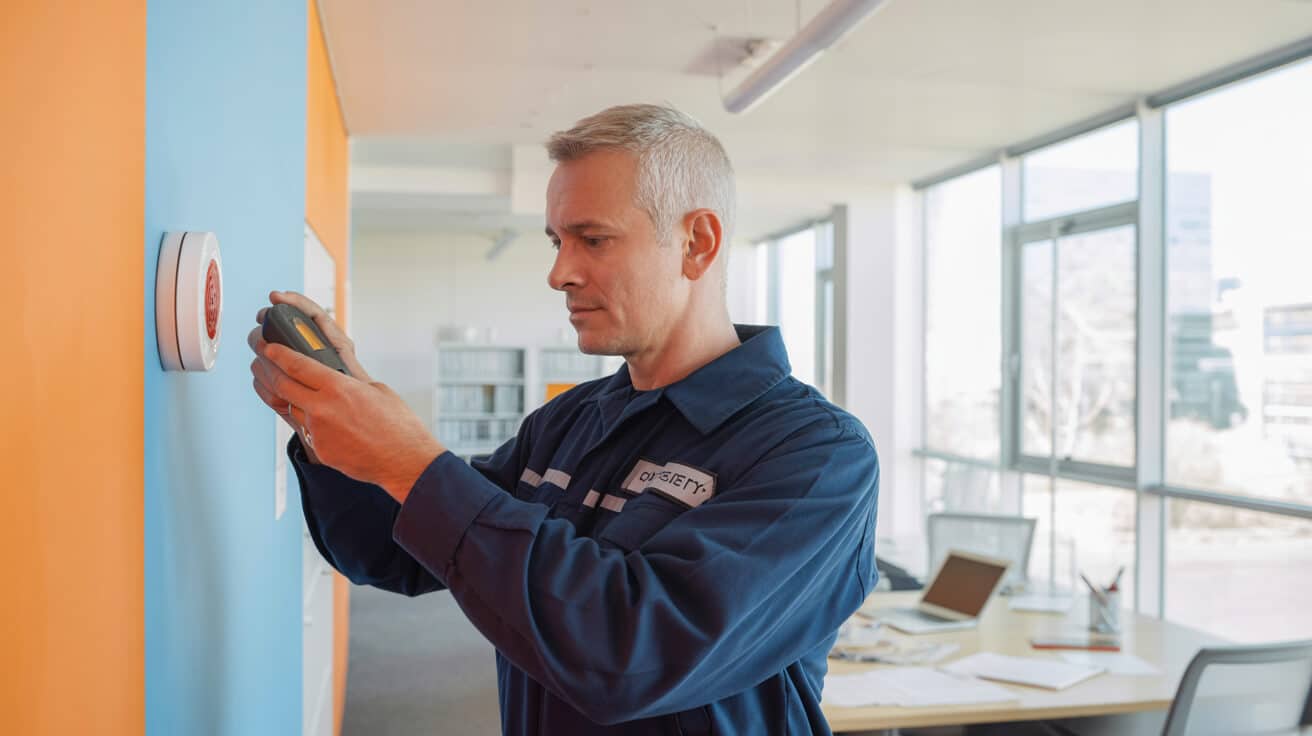
How a live electrical thermal imaging survey is carried out on-site
![[ALTTOKEN]](https://allservices4u.co.uk/app/uploads/2026/01/02-Thermal-Imaging-Survey-PPM-Services-UK-Electrical-Fault-Detection.jpg)
A good survey should fit into your operations cleanly while staying inside your electrical safety rules.
Access and safety
You control the rules for live access. The survey team works within your permit‑to‑work, isolation and arc‑flash boundaries, and only opens or views equipment where it is safe and authorised to do so. In practice, this usually means scanning:
- Main LV switchboards and section boards.
- Distribution boards and riser panels.
- Motor control centres and drive panels.
- UPS input, output and bypass sections.
- EV distribution and other critical feeders.
Where steelwork, shrouds or covers prevent safe line‑of‑sight, the engineer either uses installed IR windows or records those assets as “not inspected”, with the reason clearly stated in the report.
Load conditions
Thermography is load‑dependent. If boards are lightly loaded, many faults will not show. As part of scoping, you agree when equipment is likely to be at representative load – for example normal weekday trading, a typical production shift, or usual clinic or theatre patterns in healthcare.
The survey is then timed around those periods so anomalies are meaningful, and load conditions are documented in the report so you can interpret findings in context.
What you need to provide
To keep disruption low and coverage high, you typically provide:
- A basic asset list or board schedule (or clear board photos where drawings are limited).
- Site rules, permit‑to‑work requirements and any live‑working prohibitions.
- Access notes for risers, plant rooms and secure areas.
- A named contact to coordinate escorts and local communication.
You gain a planned route through your electrical distribution with realistic expectations on what will and will not be inspected during the visit.
Thermal imaging vs EICR vs PAT – how to use all three without compliance confusion
You do not have to choose between thermography, fixed‑wire testing and portable appliance testing; you need to use each tool for the job it is designed to do.
What each method does
- Thermal imaging: looks for abnormal heat on live equipment under load. It helps you find developing faults and prioritise remedial work.
- EICR / fixed‑wire testing: verifies the safety of the fixed installation against wiring regulations. It checks continuity, insulation resistance, earthing, fault loop impedance and protective device performance.
- PAT: focuses on portable and movable equipment, looking for insulation damage, incorrect wiring and unsafe appliances.
Thermography answers “where are components running hotter than they should under normal operation?”. EICR answers “is the fixed wiring safe and compliant?”. PAT answers “are portable items safe to keep in service?”.
How they work together in PPM
A sensible PPM strategy typically:
- Uses thermal imaging at or near peak load to identify and rank hot joints, overloads and imbalance on distribution and critical plant.
- Schedules EICR at agreed intervals, often during planned shutdown windows, to prove core safety parameters that cannot be checked with an IR camera.
- Uses PAT on the cycle appropriate to risk and appliance type.
Thermography then feeds into testing and maintenance by highlighting which boards, circuits and components merit closer attention, earlier testing or priority replacement.
Accreditations & Certifications


How often to run thermal imaging in PPM – baselines, risk tiers and multi-site consistency
![[ALTTOKEN]](https://allservices4u.co.uk/app/uploads/2026/01/03-Thermal-Imaging-Survey-PPM-Services-UK-Electrical-Fault-Detection.jpg)
Frequency is not set by law; it is set by risk, maturity and how you use the findings.
Baseline cadence
Many organisations choose an annual electrical thermal imaging survey as a straightforward baseline that stakeholders recognise as reasonable. That gives you repeatable year‑on‑year comparison, evidence of regular condition monitoring under load, and a simple storey to present to insurers and boards.
From there, you adjust up or down for specific assets based on what the survey and your history show.
Risk‑based tiering
You might, for example, move to:
- More frequent scanning: for:
- High‑energy, high‑consequence assets such as main LV boards, MCCs feeding critical plant, UPS distribution and major risers.
- Areas with harsh environments, vibration or known overheating history.
- Sites with very low tolerance for downtime (data centres, healthcare, continuous manufacturing).
- Less frequent scanning: where:
- Condition has remained stable over several cycles.
- Consequences of failure are modest and easily mitigated.
- Other monitoring or redundancy reduces risk.
The key is to document the factors you use – criticality, environment, duty cycle, fault history, recent modifications – so your intervals are explainable and repeatable.
Portfolio consistency and close-out
Across multiple buildings, you gain more value when:
- Asset names, locations and board IDs follow a consistent pattern.
- Severity labels and grading criteria are standardised.
- High‑severity findings have agreed re‑scan windows built into your plan.
That way, you can trend condition between sites and years rather than starting from scratch with each new contractor, and you can explain your approach in a way that stands up to scrutiny.
What you should receive after the survey – report contents, severity grading, and engineer-ready actions
The usefulness of a survey lives or dies in the quality of the report you receive.
Core report contents
As a minimum, you should expect:
- An executive summary highlighting key risks and recommended priorities.
- A clear list of assets inspected and those not inspected, with reasons.
- Paired thermal and visual images for each finding, with labels that match your asset register.
- Notes on load and environmental conditions at the time of inspection.
- A structured findings table with severity, recommended action and suggested timescale.
This lets you see what was done, what was seen and where your immediate focus should be.
Severity grading that does not “cry wolf”
Severity grading should combine:
- Temperature difference relative to comparable phases or components.
- The function and rating of the device.
- Proximity to combustible materials or vulnerable areas.
- Operational impact if the component fails.
Clear categories such as “urgent – remove from service or repair as soon as practicable”, “high – plan remedial work in the next maintenance window”, and “monitor – recheck on next scheduled scan” make it easier to plan work and justify priorities.
Actions engineers and stakeholders can actually use
Each finding should read like the start of a work order, not just a comment. That means:
- Exact location (board designation, panel, way, feeder).
- Suspected issue (for example loose termination, overload, imbalance).
- Recommended action type (tighten, re‑terminate, replace device, rebalance load, investigate harmonics).
- Suggested follow‑up testing where appropriate.
That turns a thermography report into a task list your own teams or contractors can act on, and into an evidence pack when you need to show what was done and why.
Competence, safety governance and assurance – what to check before appointing a thermal imaging provider
Who you instruct matters as much as the camera they use.
Competence and qualifications
You should be comfortable that:
- Surveyors have appropriate thermography training and certification for condition‑monitoring work.
- They have electrical experience and understand safe working on LV and, where relevant, HV systems.
- Their scope of competence is clearly defined, including any supervision arrangements.
Ask for evidence, not just assurances: training records, experience summaries and example projects in environments similar to yours.
Safety and method control
Before any live inspection, you should see:
- A method statement that shows how the survey will work within your electrical safety rules and permits.
- Risk assessments that address arc‑flash boundaries, isolation rules, access constraints and housekeeping.
- A clear statement of what will be opened, what will not, and how exclusions will be documented.
This protects your people, your assets and your legal duties while still capturing useful data.
Contracts, insurance and data handling
From a governance perspective, you should also check that:
- Public liability and, where relevant, professional indemnity insurance are in place at suitable levels.
- Your contract or purchase order sets out reporting content, severity rubric, turnaround expectations and re‑scan options.
- Arrangements for storing and sharing images and reports respect any confidentiality or data protection constraints you have, especially on sensitive sites.
Those checks give you confidence that a thermal imaging programme will support your compliance position rather than introduce new uncertainties.
Reliable Property Maintenance You Can Trust
From routine upkeep to urgent repairs, our certified team delivers dependable property maintenance services 24/7 across the UK. Fast response, skilled professionals, and fully insured support to keep your property running smoothly.

Book Your Free Consultation With All Services 4U Today
A short scoping conversation is often the fastest way for you to see how thermal imaging could strengthen your PPM and evidence base. Book a brief consultation and use that time to confirm whether a structured thermal imaging programme is the right fit for your sites.
During your consultation, you share the essentials – the type and number of buildings, approximate count of main boards and critical panels, any known problem areas, and how your current electrical maintenance is structured. The team then outlines a survey approach that fits your access constraints, load patterns and governance requirements.
You gain a clear picture of which assets would be prioritised, how often they should be scanned, what the report will look like, and how findings can flow into your CAFM or work‑order system. You also see how optional re‑scan verification slots can be built into your programme so serious issues are not just “fixed”, but proven to have normalised.
If you want a safer, more predictable electrical maintenance regime with stronger evidence for stakeholders, move now rather than waiting for faults to expose weak spots. Contact All Services 4U to scope your thermal imaging PPM plan and turn “we think it is fine” into “here is the proof”.
Frequently Asked Questions
Explore our FAQs to find answers to planned preventative maintenance questions you may have.
What does an electrical thermal imaging survey actually cover, beyond “someone waving a camera at boards”?
An electrical thermal imaging survey is a structured, live thermography inspection of defined assets that finds developing faults under load before they cause trips, damage or downtime.
A proper electrical thermography survey starts with a clear scope, not a wander around the plant with a gadget. Under your permits and Electricity at Work Regulations controls, the thermographer works through an agreed asset list: main LV switchboards, riser and landlord distribution boards, MCCs, critical plant boards, UPS input/output/bypass sections and EV charging distribution or other major feeders. Panels are only opened where it is authorised, safe and practical; anything that cannot be inspected is logged as an explicit exclusion so coverage is honest.
Each asset is scanned at representative load, with camera settings such as emissivity and reflected temperature set deliberately rather than left at defaults. The aim is to spot abnormal heat patterns between phases or comparable components that indicate loose terminations, overload, imbalance or component deterioration, not to create dramatic pictures for a slide deck. Findings are captured in a repeatable format so you can trend issues over time instead of treating every survey like a one‑off event.
When you use a structured electrical thermal imaging survey from a provider such as All Services 4U and competent thermal imaging electricians, you are buying a method and coverage map, not just a camera. That is what lets you point to a specific board next year and say with confidence, “this was inspected, here is what we saw, and here is how we acted”.
Typical scope in a well‑designed electrical thermography survey
- Main LV switchboards and section boards feeding multiple risers or plant rooms
- Key riser and landlord distribution boards serving common areas and critical services
- MCCs and drive panels supporting HVAC, pumps and production equipment
- UPS input, output and bypass paths supporting IT or life‑safety loads
- EV charging distribution, rising mains and other high‑load feeders identified in your risk register
How often should you schedule electrical thermal imaging in a UK PPM plan so it is risk‑based and defensible?
Most UK portfolios use an annual electrical thermography sweep as a baseline, then step frequency up or down by asset risk, environment and change.
An annual electrical thermal imaging survey across your main boards, risers, MCCs, UPS and landlord distribution boards is a pragmatic starting point: it complements your EICR intervals under BS 7671 and demonstrates to boards, insurers and regulators that you are checking live condition under load, not just waiting for protection devices to operate. That yearly pass gives you a baseline to trend against; you can see whether hotspots are recurring, moving, or disappearing after remedial work.
Beyond that, frequency is a risk conversation, not guesswork. High‑consequence assets such as data halls, theatres, healthcare plant, control rooms or production lines often justify six‑monthly or targeted interim scans, especially after modification, high‑load events or incident investigations. Low‑impact areas with stable history, clean environments and modest loading can usually stay on the annual cycle and travel in lock‑step with other planned works.
Providers like All Services 4U fold this into your planned preventive maintenance calendar so thermography aligns with access windows, existing shutdowns and EICR dates rather than creating extra isolated visits. That is what keeps you on the right side of your risk appetite without overspending on repeat surveys that do not materially change decisions.
Simple tiered cadence for electrical thermography
| Tier | Typical frequency | Examples of assets |
|---|---|---|
| **Tier 1 – Critical** | Annual plus on‑change / post‑incident | MSBs, MCCs, UPS boards, major risers, data halls |
| **Tier 2 – Important** | Annual baseline | Landlord/common D/Bs, key plant boards |
| **Tier 3 – Lower impact** | Align with other works (e.g. EICR) | Small local boards serving non‑critical office loads |
If you want to be able to explain to an auditor or insurer exactly why a given board is on an annual, six‑monthly or “on change” thermography cycle, a documented matrix like this, backed by repeat surveys, is what makes your programme defensible.
How do you turn thermal imaging findings into structured CAFM/CMMS work orders instead of “interesting pictures in a PDF”?
Electrical thermography adds real value when every credible hotspot becomes a traceable work order with clear actions, verification and trend history.
In a mature maintenance set‑up, a thermal imaging survey is the start of the process, not the end. Each anomaly your surveyor flags should automatically become a structured record in your CAFM or CMMS, tied to a single asset and location. At minimum, that record should hold: the asset and board ID, panel location, the exact component affected, phase‑to‑phase temperature comparison, description of the anomaly, likely root cause (for example loose termination, imbalance or overload), severity code and recommended next action.
From that record, you raise a corrective work order with predefined tasks: isolate safely, retorque or re‑terminate, replace suspect components, rebalance phases or redistribute loads. For higher‑severity or complex findings, you then schedule a verification re‑scan and attach the “after” thermograms to the same asset and job ID. Over time, this gives you a closed‑loop view: you can see which boards keep reappearing, which issues stay fixed, and where design or loading changes might be needed.
All Services 4U structures electrical thermal imaging reports with this loop in mind: findings tables are designed to line up with common SLA codes and asset taxonomies, so your team is not re‑keying free‑text into your system. That is how you shift from “we had a survey” to “we have a measurable reduction in repeat hotspots and nuisance trips across the portfolio”.
Data fields that make thermography–to–work‑order integration painless
- Asset ID, board ID and clear physical location within the building
- Thermographic images before (and, where applicable, after) remedial work
- Temperature data and severity/priority codes aligned with your SLA model
- Linked corrective job IDs and scheduled verification re‑scan entries
What competency, safety and calibration checks should you insist on before trusting an electrical thermal imaging report?
You should only rely on electrical thermography reports that come from trained surveyors using calibrated equipment, working to a documented method under your electrical safety rules.
If you are discharging your duties under the Electricity at Work Regulations, it is not enough that a contractor owns a thermal camera; you need confidence in the person, the instrument and the method. Start with competency: ask who will attend site, what formal thermography training they hold (for example training aligned to ISO 18436‑7 or equivalent), their electrical experience at the voltages and systems you operate, and their familiarity with your type of environment, whether residential blocks, healthcare, industrial or commercial.
Next, look at the equipment and its control. A professional provider should be able to show current calibration certificates for the cameras they use, traceable to a competent lab, and be able to explain how emissivity, reflected temperature, focus and distance are managed during the survey. You also want to see RAMS that align to your permit‑to‑work process, clear roles and responsibilities on site, and insurance that reflects the risk profile of live electrical inspection.
Providers such as All Services 4U will usually share sample reports, method statements and a statement of limitations up‑front so you can see exactly what will and will not be inspected. That transparency is what lets you sign off on the risk and answer governance questions later about how you selected and monitored your thermal imaging contractor.
Minimum assurance evidence before you rely on a thermography report
- Named surveyors with relevant thermography training and electrical competence
- Current, traceable calibration certificate for every camera model used
- Method statement and risk assessment aligned with your site permits and LV safety rules
- Clear written statement of exclusions, load limitations and access constraints in each report
How should you explain the difference between electrical thermal imaging and an EICR so boards, residents and insurers see them as complementary, not competing?
Electrical thermal imaging shows where live equipment is running abnormally hot under load, while an EICR proves the fixed wiring still complies with BS 7671 when it is tested.
The cleanest way to explain this to non‑technical stakeholders is to separate live behaviour from formal compliance testing. Electrical thermography is a non‑intrusive, live inspection: cameras are used on energised panels to pick up early‑stage problems such as loose terminations, unbalanced loads, overloaded paths or failing components before they escalate into trips, damage or downtime. It is a condition‑monitoring tool that gives you a visual, temperature‑based view of how the system is performing in service.
An Electrical Installation Condition Report (EICR) is different. It is a structured series of inspections and tests carried out at defined intervals under BS 7671 – Requirements for Electrical Installations. Circuits are isolated and tested for continuity, insulation resistance, fault loop impedance and RCD performance to verify that the fixed wiring still meets the wiring regulations. The EICR is the document most lenders, landlords and regulators will look for when they ask whether the installation is compliant.
For boards, residents and insurers, the message is simple: thermal imaging helps you decide where to focus maintenance effort and supports your position that you are proactive about electrical risk, but it does not replace statutory inspection and testing. All Services 4U can schedule electrical thermal imaging surveys to sit alongside your EICR programme so both sets of evidence support each other rather than fighting for access windows.
Side‑by‑side view you can reuse in meetings
| Aspect | Electrical thermal imaging | EICR (BS 7671) |
|---|---|---|
| Main purpose | Find hot spots under normal load | Prove fixed wiring meets current regulations |
| System state | Live, energised | Circuits often isolated for testing |
| Typical issues found | Loose terminations, imbalance, overload, failing components | Insulation breakdown, poor earths, unsafe circuits |
| Key output | Thermography findings and recommendations | Formal condition report with coding of defects |
When you position electrical thermography as the live condition layer and the EICR as the formal compliance layer, people stop asking “which one do we need?” and start seeing how using both reduces surprises and shortens fault‑finding time.
What does a “good” electrical thermal imaging report and evidence pack look like if you want to satisfy auditors, insurers and your own engineers?
A good electrical thermography report lets engineers act the next day and lets auditors see exactly what was checked, what was found and how you prioritised the work.
From an engineering point of view, a strong report starts with clarity: an executive summary of key risks, a full asset and coverage list, and explicit exclusions where panels could not be accessed or were not under suitable load. The findings table should show severity, likely cause, recommended action and suggested timeframe for each anomaly, using language that maps cleanly to your maintenance tasks so it is easy to issue work orders.
Each finding should be backed by paired visual and thermal images, clearly labelled so they align with your asset register, board schedule and panel labelling on site. Load and ambient conditions should be recorded so temperature differences are meaningful, and the grading logic should be explained in words as well as colours, so you can justify why a given hotspot sits in a particular severity band. For higher‑risk items, including a suggested re‑scan after remedial work makes it easier to prove that temperatures have normalised.
For governance audiences, the same pack needs to show method and competence without drowning them in pixels: one section that summarises scope, method, limitations, survey dates, surveyor names and calibration status does a lot of heavy lifting here. All Services 4U routinely folds this into an evidence‑ready bundle so you can drop it straight into your compliance binder or digital “golden thread”.
Checklist for an audit‑ready electrical thermography pack
- Clear summary of key risks, priorities and suggested timeframes for action
- Asset and coverage list with explicit exclusions and any load limitations
- Labelled visual and thermal images for every recorded finding
- Severity grading with explanation of the thresholds and associated actions
- Method, safety and competency notes, including surveyor names and camera calibration details
- Optional before/after re‑scan evidence for critical or insurer‑sensitive items
How do All Services 4U’s electrical thermal imaging PPM services make your role less reactive and more defensible?
All Services 4U turns electrical thermal imaging into a repeatable PPM service that drops into your existing workflows, reduces surprises and strengthens your position with boards, residents, insurers and lenders.
You do not need another standalone “project” to manage; you need electrical thermography that fits how your team already runs property maintenance. With All Services 4U, you start by sharing the basics: a board list or photos, site count, any known trouble spots, and practical constraints such as access windows, permit rules and shutdown dates. From there, the survey route is designed to prioritise your most critical assets, line up with real‑world load conditions, and respect the way your organisation manages live electrical work.
After each electrical thermography visit, you receive a report that behaves like a prioritised action list for your engineers: anomalies are already grouped by severity, asset and recommended next step, so your CAFM/CMMS can absorb them with minimal rework. Where you want it, All Services 4U can align field names and codes to your existing job schemas and SLA model so findings flow into live jobs and verification re‑scans without needing a spreadsheet in the middle.
Over successive surveys, you see patterns: repeat hotspots shrink, nuisance trips drop, and conversations with insurers or lenders shift from “we react fast” to “here is our proactive evidence trail for electrical risk across the portfolio”. That is where electrical thermal imaging stops being a tick‑box exercise and becomes a predictable part of your planned maintenance and risk narrative.
If you want your team to be recognised internally as the people who quietly keep electrical risk under control—with clear evidence of what you inspected, what you fixed and how you know it stayed fixed—starting with a focused pilot thermal imaging survey from All Services 4U on one building or a cluster of critical boards is a low‑friction way to prove the model and build support for wider rollout.
Practical starting points with All Services 4U
- Use one representative building or a defined set of critical boards as a pilot baseline
- Ask for a sample electrical thermography report mapped to your current asset register and job fields
- Align the first survey window with your next PPM shut‑down or EICR cycle so disruption for residents and occupiers stays minimal
- Using thermal imaging surveys to control electrical risk
- What an electrical thermal imaging survey is – and why “no issues reported” isn’t the same as “risk controlled”
- Which electrical faults thermography can realistically flag in buildings – and which it cannot
- How a live electrical thermal imaging survey is carried out on-site
- Thermal imaging vs EICR vs PAT – how to use all three without compliance confusion
- How often to run thermal imaging in PPM – baselines, risk tiers and multi-site consistency
- What you should receive after the survey – report contents, severity grading, and engineer-ready actions
- Competence, safety governance and assurance – what to check before appointing a thermal imaging provider
- Book Your Free Consultation With All Services 4U Today
- Frequently Asked Questions
- Related PPM Services
Case Studies


Related Articles

Your Guide To Identifying And Treating Minor Mould Outbreaks
Why Planned Preventative Maintenance (Ppm) Saves Money And Ensures Compliance